
In the world of non-alcoholic beverages, Americans are always excited to try the latest, most exciting products – and brands have taken notice. Whether it was sparkling waters, coffees, teas, or anything in between, brands flooded the market with more than 4,000 new product launches in the year of 2018. Here, we take a look at trends from those beverage innovations and what they tell us about the future of the non-alcoholic beverage category.
Here are five facts you need to know about the state of the non-alcoholic beverage industry:
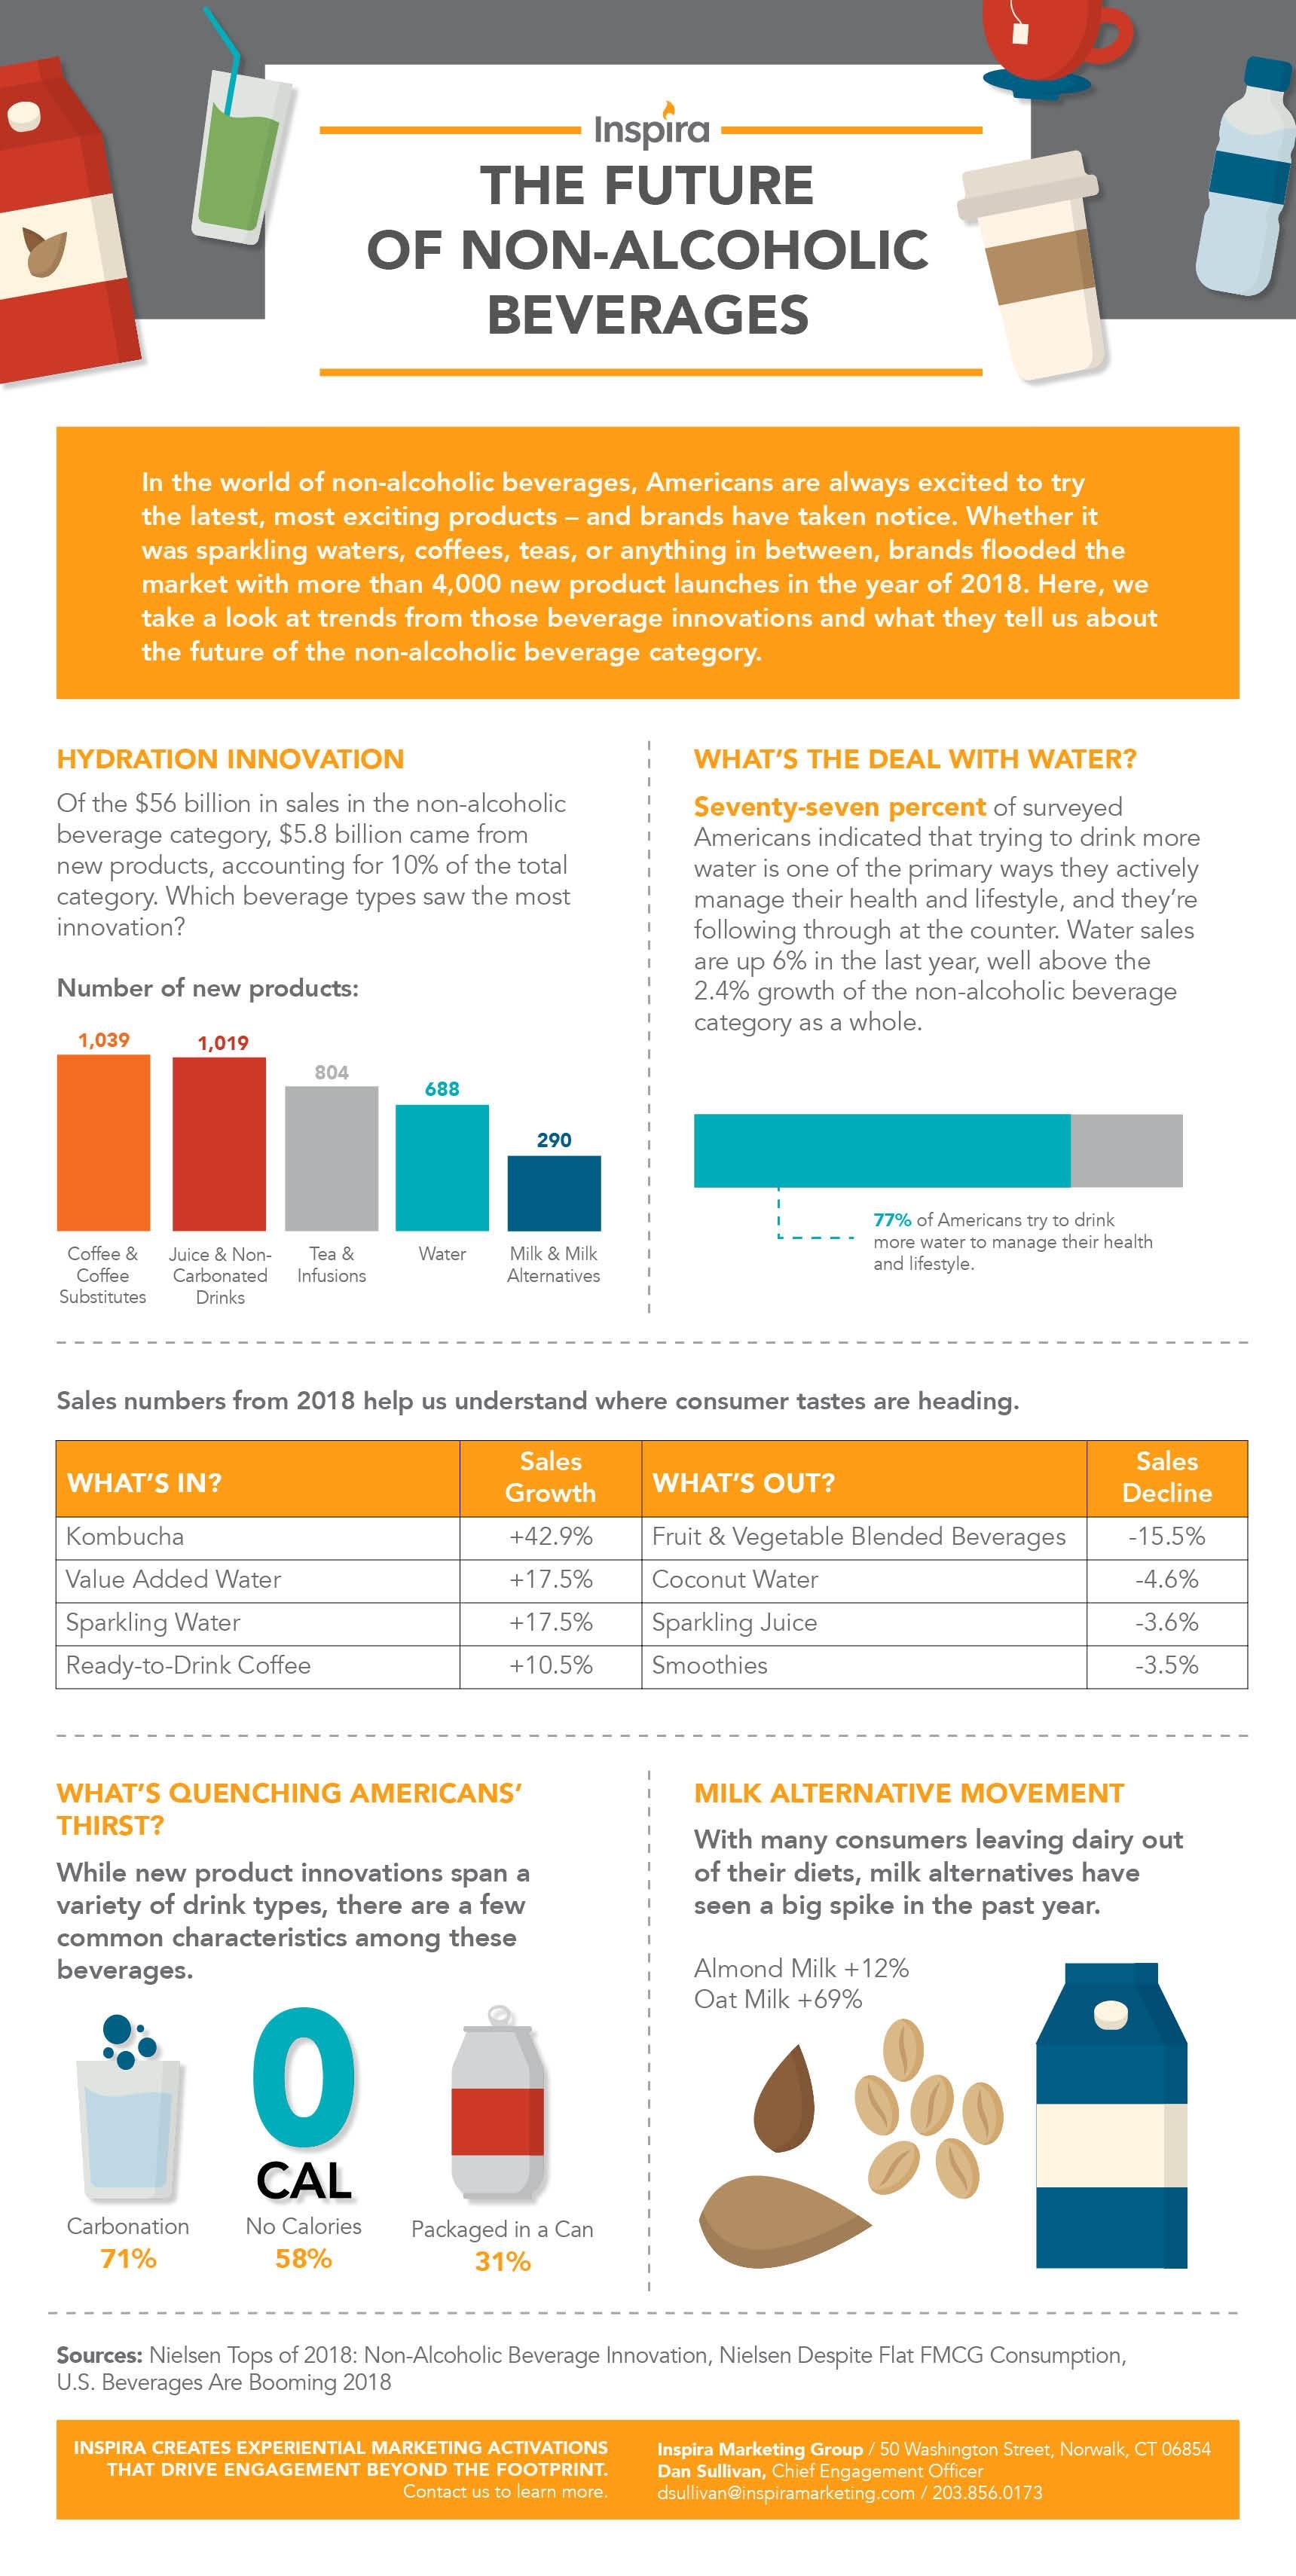
Hydration Innovation
Of the $56 billion in sales in the non-alcoholic beverage category, $5.8 billion came from new products, accounting for 10% of the total category. Which beverage types saw the most innovation?
- Coffee and Coffee Substitutes: 1,039 (new products)
- Juice and Non-Carbonated Drinks: 1,019
- Tea and Infusions: 804
- Water: 688
- Milk and Milk Alternatives: 290
What’s In? What’s Out?
Sales numbers from 2018 help us understand where consumer tastes are heading.
Kombucha +42.9% (sales growth)
Value Added Water +17.5%
Sparkling Water +17.5%
Ready-to-Drink Coffee +10.5%
Fruit & Vegetable Blended Beverages -15.5%
Coconut Water -4.6%
Sparkling Juice -3.6%
Smoothies -3.5%
What’s Quenching Americans’ Thirst?
While new product innovations span a variety of drink types, there are a few common characteristics among these beverages.
- Carbonation: 71% (of innovation items)
- No Calories: 58%
- Packaged in a Can: 31%
What’s the Deal With Water?
Seventy-seven percent of surveyed Americans indicated that trying to drink more water is one of the primary ways they actively manage their health and lifestyle, and they’re following through at the counter. Water sales are up 6% in the last year, well above the 2.4% growth of the non-alcoholic beverage category as a whole.
Milk Alternative Movement
With many consumers leaving dairy out of their diets, milk alternatives have seen a big spike in the past year.
- Almond Milk +12%
- Oat Milk +69%
Looking to cut through the clutter and increase awareness for your non-alcoholic beverage innovation? Contact us today to learn how our suite of experiential-led services can help you build long-lasting connections with consumers.
