Juneteenth is here, and while it is a time to celebrate it’s also a sobering reminder of the work still to be done.
Infographic: Advancing Black Businesses this Juneteenth
Jun 19, 2023 7:00:00 AM / by Bobby Johnson posted in Infographics
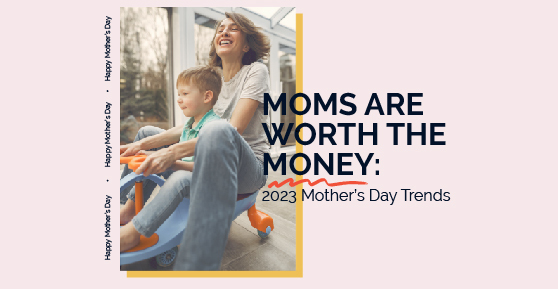
Infographic: Moms Are Worth the Money: 2023 Mother’s Day Trends
May 10, 2023 6:38:19 PM / by Bobby Johnson posted in Infographics
The economy may be sluggish, but that hasn’t stopped consumers from showing their love and appreciation for the special women in their lives.
Infographic: How Brands Can Deliver Recipe Inspiration
May 3, 2023 10:30:00 AM / by Ann D'Adamo posted in Infographics
In our newest infographic, we’re looking at what consumers want to add to their diet and what they want to avoid. We also examine how marketers can capture their attention–and most importantly, their appetite!
Infographic: Is Inflation Boosting Financial Literacy?
Apr 6, 2023 6:00:00 PM / by Bobby Johnson posted in Infographics, Financial Services
April is Financial Literacy month, the perfect time to explore how financial literacy is more important to consumers in 2023 than ever before.
Infographic: Employee Appreciation Day is Not Optional
Mar 1, 2023 3:55:41 PM / by Bobby Johnson posted in Experiential, Infographics
March 3rd is Employee Appreciation Day, when companies recognize and appreciate the efforts of their team members. It’s an important day, and if you employ or lead any kind of team, this day should have your attention.
Infographic: Consumer Sampling - How Trying Leads to Buying
Apr 12, 2022 4:40:14 PM / by Madison Zoey Vettorino posted in Insights, Infographics, CPG, Beverage, Food
After two years of pandemic purchasing , tangible hands-on sampling is gearing-up to enhance the consumer buying experience.
Infographic: An Update From Gen Z
Dec 14, 2021 4:08:50 PM / by Madison Zoey Vettorino posted in Infographics
Did you know that Gen Z constitutes nearly a quarter of the U.S. population? This group, born between 1997 and 2012, has garnered quite a reputation for itself. Between their social media usage, unique consumer behaviors, and socially conscious opinions, Gen Z’s contributions are plentiful and varied. In addition to this, Gen Zers are the most diverse generation thus far. It’s fitting that a generation that matured during the rise of the internet has constantly evolving interests that can change at lightning speed. Here’s what you need to know about Gen Z.
Infographic: The State of The Automobile Industry
Oct 15, 2021 4:36:52 PM / by Mary McMillan posted in Infographics
Between stay-at-home orders and the normalization of working from home, the automobile industry was impacted tremendously by COVID-19. But now, there’s reason to be optimistic about the future of the industry. Though 48% of drivers across the globe spend less time driving than they did before the pandemic, the industry is going strong. This year, worldwide car sales are predicted to reach 71.4 million, increasing 7.6 points from 63.8 million in 2020. Here’s everything you need to know about the state of the automobile industry in 2021.
Infographic: Halloween Delivers Marketing Treats
Oct 1, 2021 11:46:01 AM / by Mary McMillan posted in Infographics
Halloween is America’s third favorite holiday, trailing only behind Christmas and Thanksgiving. 65% of Americans plan to celebrate Halloween in 2021. Although COVID concerns impacted participation in 2020, consumers still spent about $8 billion on Halloween costumes, decor, candy, and more. This year, Halloween spending is predicted to reach an all-time high of over $10 billion. Let’s dive into some facts about consumer spending for Halloween, when people begin to prepare, and consumer sentiment around this year’s holiday.
Infographic: Checking in with Gen Z
Jul 19, 2021 9:16:24 AM / by Rob Patterson posted in Insights, Infographics
Born from 1997-2012, the oldest of Gen Zs are entering adulthood. With this generation accounting for almost a quarter of the United States population and an ever-increasing amount of spending power, brands need to pay attention. How have Gen Z attitudes and behaviors been shaped by the pandemic over the past year? Learn more in the infographic below.


.png)


